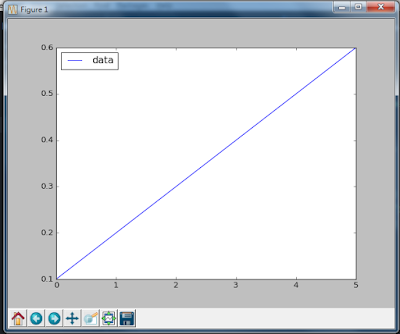
身為數據分析的工程師,除了把解算資料跟處理演算法,另外需要學習的就是怎麼 "出一張好圖" 的能力了吧!
還好有 matplotlib 的方便好用,讓我出圖沒煩惱XD
不過總覺得對於常用的選項參數都設定的不是很好...原本都只是把資料進去之後,做個 plt.show() 就好了。
可是這樣子的圖很醜...
剛好今天我要做一個程式,要放在簡報上面的,想要弄的精緻一點,就了解了一下,產出這張圖:
好看多了吧!,多了文字就是不一樣,code 如下:
還好有 matplotlib 的方便好用,讓我出圖沒煩惱XD
不過總覺得對於常用的選項參數都設定的不是很好...原本都只是把資料進去之後,做個 plt.show() 就好了。
# import matplotlib 的 pyplot 模組

import matplotlib.pyplot as plt


# 把資料 data = [0.1, 0.2, 0.3, 0.4, 0.5, 0.6] 直接放進 plt.plot() 裡面

#預設會把這筆資料當成 y 下去出圖

plt.plot(data1, label = "data1")


#plt.legend() 會把 label show 出來

plt.legend(loc="best")

plt.show()
可是這樣子的圖很醜...
剛好今天我要做一個程式,要放在簡報上面的,想要弄的精緻一點,就了解了一下,產出這張圖:
好看多了吧!,多了文字就是不一樣,code 如下:
#一樣只需要 pyplot

import matplotlib.pyplot as plt

fig  = plt.figure()

fig.suptitle('GPSTimer fit', fontsize=14, fontweight='bold')  #設定 fig 的title


ax = fig.add_subplot(111)  #在fig 裡面放一張圖面ax (也可以放多張在同一個fig 下)

fig.subplots_adjust(top=0.9)  #ax 在 fig 裡面的調整

ax.set_title('ax title')  #ax 的 title 設定

ax.set_xlabel('time(mins)')  # 設定x軸的標籤

ax.set_ylabel('offset between raspi os time and gpstime') # 設定y軸的標籤

ax.axis([0,400,-0.01,0.04]) # X 軸 與 Y軸的上下限


ax.text(100, -0.005, '1st order fit: f(x)= %.6fx + (%.6f)' %(z[0],z[1]), fontsize=14, bbox={'facecolor': 'w', 'alpha':0.3, 'pad':3}) # 放入指定文字與調整大小、邊框


ax.grid() #顯示分隔線


ax.plot(offset_1121, label = "2016.11.21") #放入資料

ax.plot(offset_1202, label = "2016.12.02") #放入資料

ax.legend(loc='best') # 顯示圖說

ax.plot(x_1121, f_x, 'k-', linewidth=3) #放入資料(這是我的一階擬合成果)


plt.show() # 出圖!


留言
張貼留言